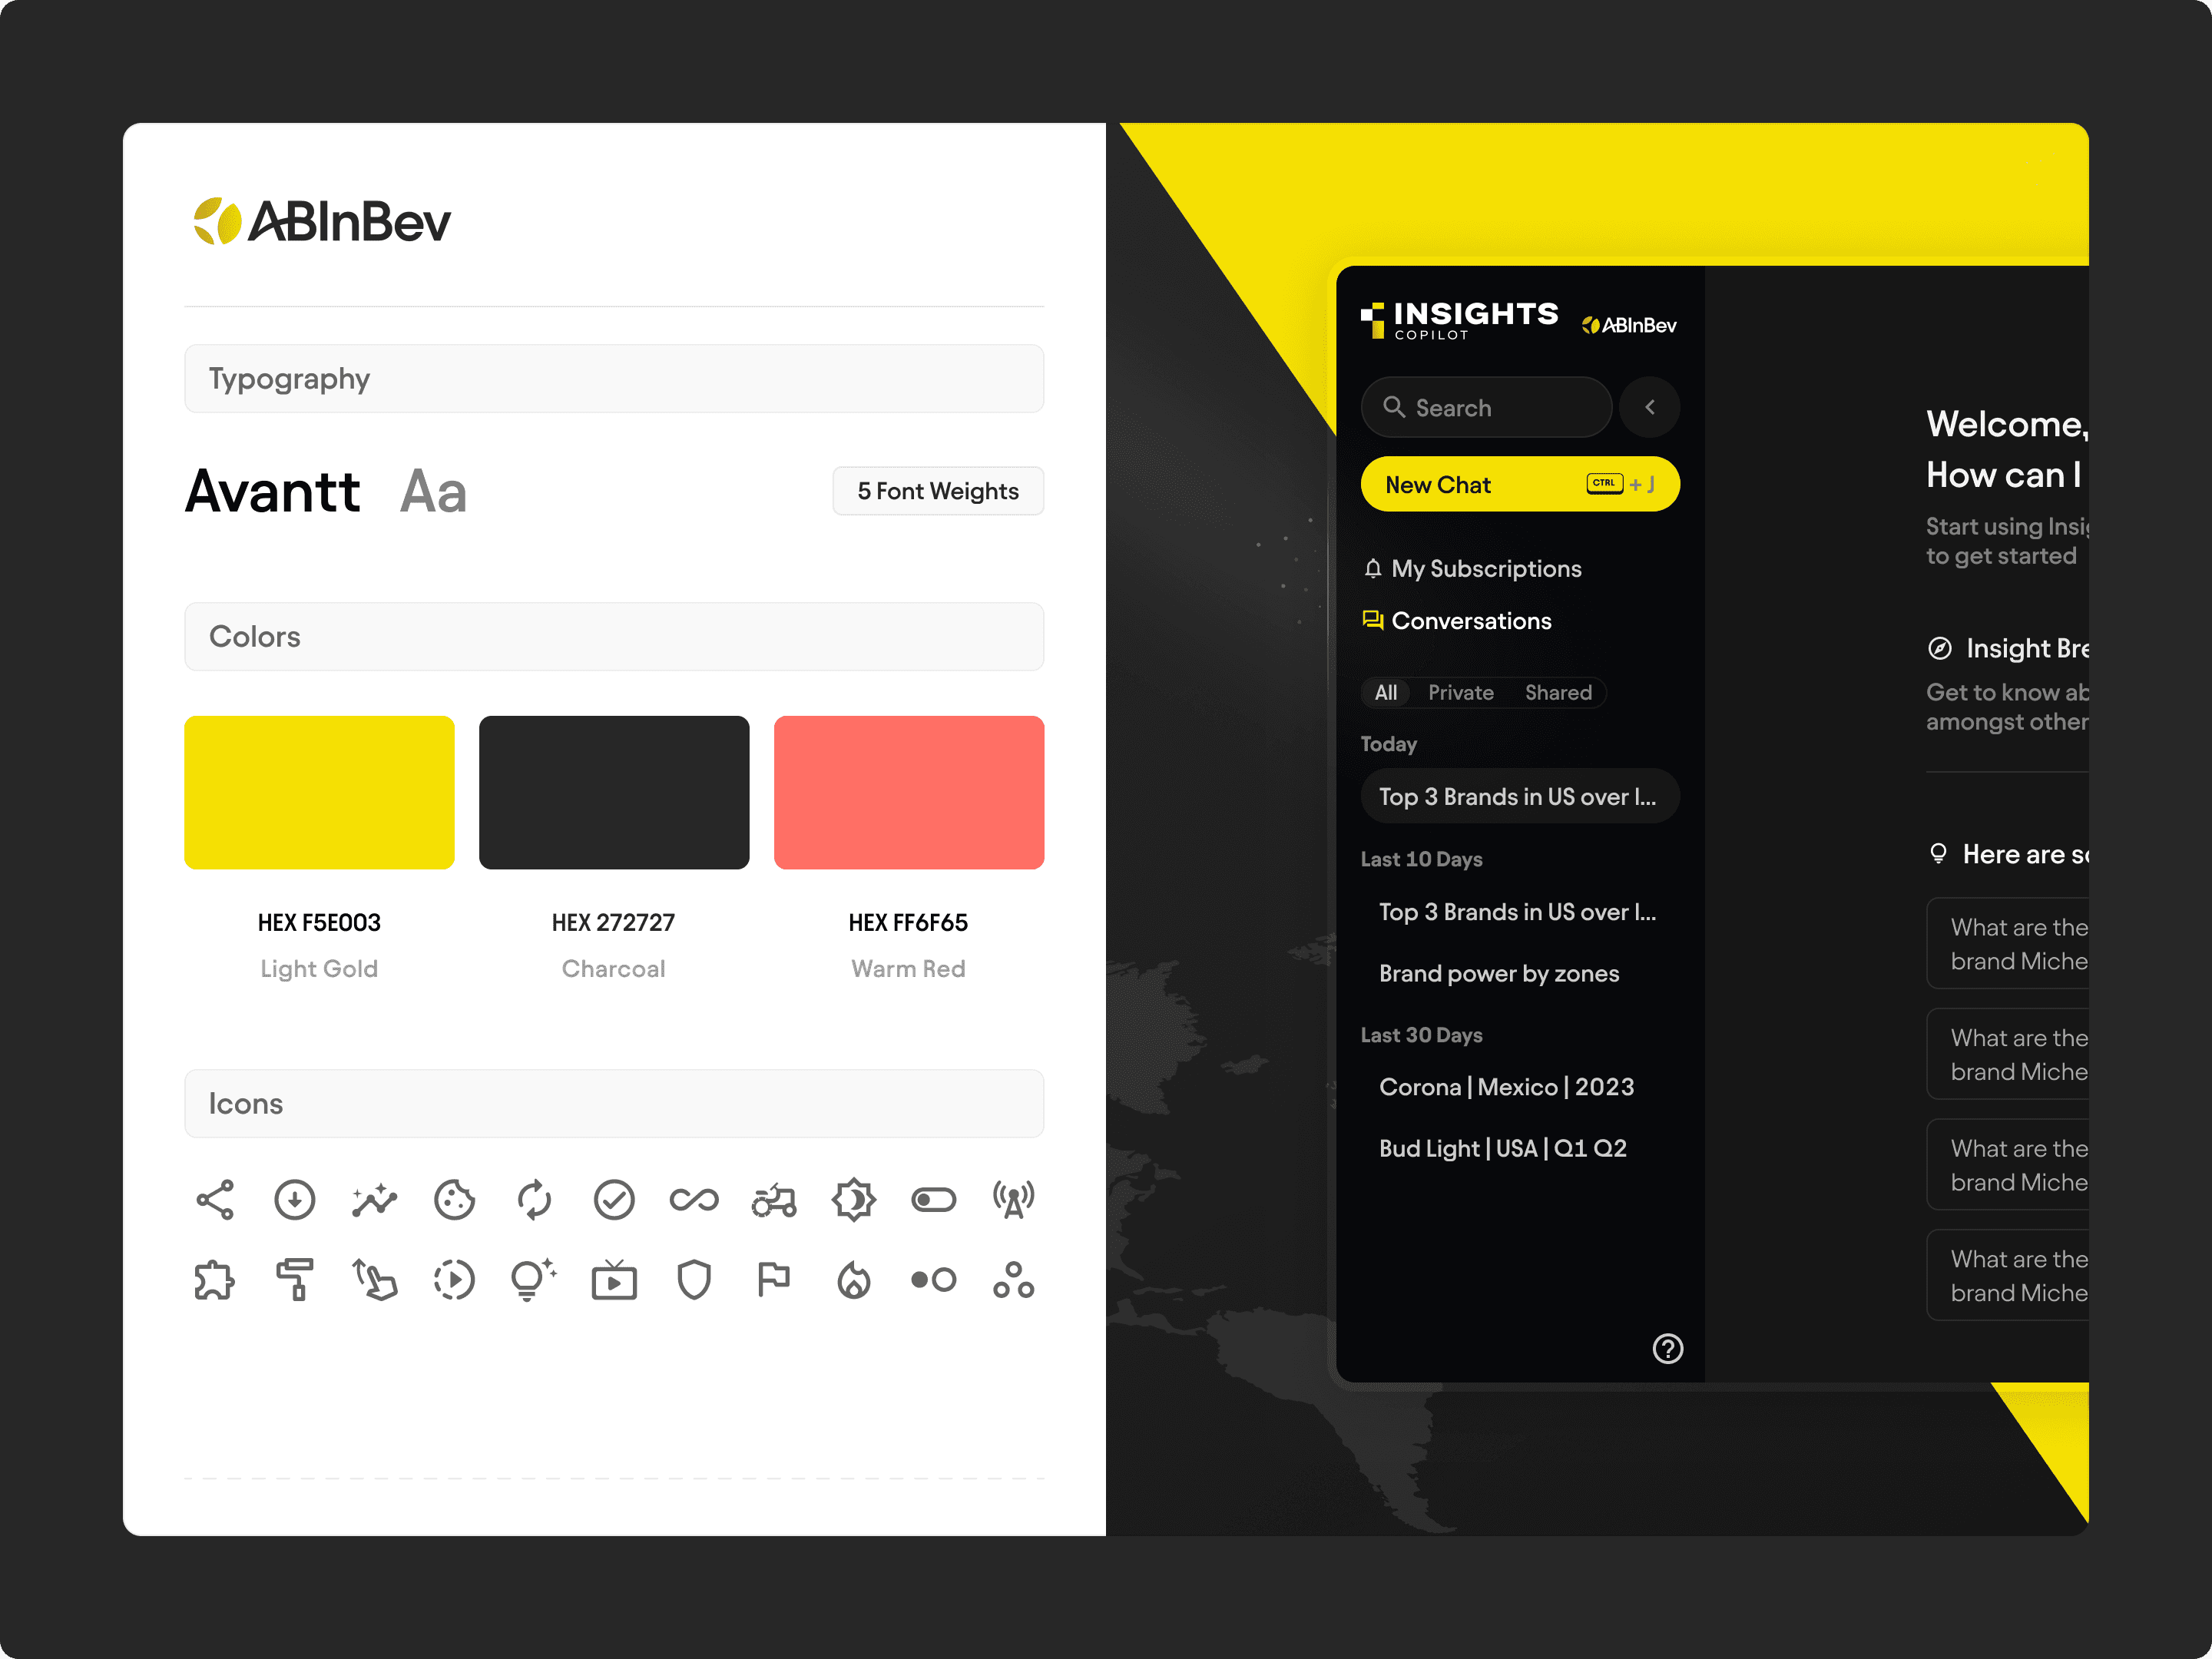

When people are working with complex business data, a strong foundation makes all the difference. The experience needed to feel clear from the very first interaction.
I started by establishing a visual system built for dark-mode enterprise work. Typography, color, iconography, and reusable interface patterns were designed to keep dense data readable while giving the product room to scale. The foundation made it easier to create consistency across conversational flows, analytics, and supporting product experiences.

The core of the experience was designed around conversation, helping teams explore business questions without having to speak the language of dashboards.
Suggested prompts, conversation history, and quick actions gave users an easy place to start. As questions became more complex, the platform surfaced summarized insights, contextual recommendations, and traceable outputs in a format that felt easy to follow. I paired conversational responses with tabular data and analysis layers so people could compare trends, validate KPIs, and make better decisions without switching between multiple enterprise tools.


The final copilot gave AB InBev a more approachable way to bring AI, data, and everyday decision-making into the same workflow.
Guided onboarding, contextual assistance, and access-management flows helped teams understand what the platform could do while keeping permissions and collaboration clear. The insights dashboard brought together KPI summaries, business indicators, and AI-generated recommendations to make ongoing exploration feel more useful and engaging. Figma, Mixpanel, Google Analytics, and Fullstory supported the process from design decisions through to experience improvement.


